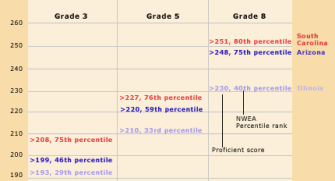
The chart shows what students must score in their respective states and grade levels to be deemed “proficient” on state math tests. It also shows the percentiles in which those states’ “cut” scores fall on the Northwest Evaluation Association tests. The percentiles reflect the proportion of a representative national student population that took the NWEA tests and performed at or below the score.

SOURCE: Northwest Evaluation Association


