
Students in the high school graduating class of 2016 scored slightly lower on the SAT than their counterparts did a year earlier, according to new results from the College Board.
But those performance data are only for the old SAT, which was retired after its final administration in January. Eagerly awaited results from the new SAT, which began in March, were not released.
The average score on the math section of the old SAT declined by 4 points. The average score on the writing section was 5 points lower, and on critical reading it was 3 points lower than for the class of 2015, according to the report released last week. Each section is scored on a 200- to 800-point scale.
SAT results for the class of 2016 are limited because some students took the new SAT and most took the old one. The College Board released performance data only for the old SAT, which was discontinued after its final administration in January. Participation data reflect both the old and new SAT, taken by members of the 2016 graduating class through June.
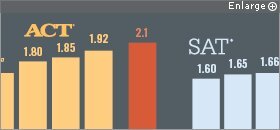
Source: College Board; ACT Inc.
Reporting SAT results for the class of 2016 was challenging, since most students took the old SAT, while only a minority took the new exam. College Board officials chose not to release scores for the new SAT, explaining that scores from three administrations only—March, May, and June—would not accurately represent the characteristics and performance of a complete, typical cohort of students. A full picture of performance on the new SAT will be released in fall 2017.
The College Board released participation data for the class of 2016 in unusual chunks, too, making it impossible to compare participation for the entire 2016 graduating class with previous classes.
For the new SAT, the organization reported that 1.36 million students took the exam in its first three administrations. That’s 180,000 more than the 1.18 million who took the old SAT during the same time span in 2015. (Those numbers include students from any graduating class, not just the class of 2016.)
A look at the old SAT alone for the class of 2016, through January, shows more students took that test than did during the same period in 2015: 1.64 million, compared with 1.63 million. The looming changeover to the new SAT might have encouraged a last-minute rush.
Numbers Unclear
For the new and old SAT combined, through June, 1.68 million students in the class of 2016 took that test, compared with 1.66 million in the same period in the class of 2015. That’s an increase of 25,600, but the College Board got that increase by revising the 2015 figure downward by about 43,000 students. That’s because, in building a new, integrated data system for all its exams, it found inconsistencies in how students had recorded their grade levels at different points in time, said Jack Buckley, the College Board’s senior vice president for research.
Without that revision, SAT participation from the class of 2015 to the class of 2016 would have shown a drop of nearly 17,400 students.
That wasn’t the first time the College Board has revised the way it calculates participation data. In 2010, it included a group of students in the count that hadn’t been included before. That revision allowed the organization to report a bigger participation figure than its rival ACT Inc. and preserve its spot as the most popular college-entrance exam, a distinction the College Board has since lost.
Cynics and close watchers of the competitive battle between the College Board and ACT noted the timing of this year’s data revision, since the College Board is under pressure to ensure that its new SAT is a success in the public eye. It also comes as the College Board is pushing hard to grab market share from ACT by winning statewide testing contracts. What’s more, the College Board has been shadowed lately by allegations that it shortcut aspects of the SAT’s design in ways that could undermine its validity, a charge it has vehemently denied.
“It’s a little fishy, because that revision is completely in their favor,” said James S. Murphy, who keeps close tabs on changes in the SAT or ACT as the director of tutoring for the Princeton Review’s New England region. Even so, Murphy allowed that he “might be willing to buy their explanation” for the 2015 revision.
Drops Across the Board
Revision or no revision, the College Board is still trailing the ACT in popularity: In the class of 2016, 2.1 million students took the ACT, though the ACT, too, saw a drop in students’ scores. (See Education Week, Aug. 31, 2016.)
Both ACT and the College Board attributed the decrease to a wider range of students taking the tests, including those with weaker academic or test-prep backgrounds.
In its battle for market share against ACT Inc., the College Board has been pushing hard to win statewide contracts, and last week, it released numbers showing the payoff: In 2015-16, 458,000 students took the SAT in statewide programs that require all students to take the test or offer it free of charge. In 2014-15, 219,500 students took the SAT in those “school day” programs. ACT has a similar program, with many more statewide contracts than the College Board.
In 2016-17, 13 states will participate in the College Board’s school day program, either requiring or offering the SAT, the PSAT, or both, for all students, according to a map released by the company last week.
In a conference call with reporters, College Board officials cast the growth in statewide SAT and PSAT administrations as an expansion of opportunity for students, because the suite of tests provides academic feedback starting in middle school and links students to more support than ever before: They’re used to provide free test-prep help, encourage promising students to try Advanced Placement study, and identify students for scholarships and college-application fee waivers.
The statewide contracts represent opportunity for the College Board, as well. Michigan’s three-year contract is worth $17.1 million, Illinois’ two-year deal is for $12.9 million, and Colorado’s five-year contract could fetch up to $12.4 million. Idaho’s contract will bring in about $1.2 million this year, and New Hampshire’s $613,000.
Expanding Tests’ Reach
In the 2015-16 school year, the College Board debuted a new PSAT 8/9, for 8th and 9th graders, and a redesigned PSAT, which is typically taken by 10th graders. It unveiled the PSAT 10 last year, too, another version of the test that 10th graders can take.
The company reported that 885,000 students took the PSAT 8/9 last year, and 247,000 students took the PSAT 10. Four million students took the PSAT, up from 3.8 million in 2014-15.
Seven percent to 8 percent more middle school students were identified last year by their PSAT scores as having “AP potential,” and 435,842 low-income students in the class of 2016 received college-application-fee waivers from the College Board, up from 428,013 in the class of 2015.


